Contractor Marketing Metrics
Stop Measuring Cost Per Lead: The Marketing Numbers Contractors Should Actually Track
Cost per lead doesn't tell you whether your marketing is profitable. These are the metrics that connect ad spend to qualified leads, sold jobs and revenue.
By AdHouse Marketing · 9 min read

When contractors start advertising, one of the first numbers they look at is cost per lead.
How many leads did we get? How much did each lead cost? Is $50 per lead good? Is $100 too expensive?
Cost per lead is useful. But on its own, it tells you surprisingly little about whether your marketing is actually working.
A cheap lead that never answers the phone is not particularly valuable. A $120 lead that turns into a $20,000 project can be incredibly profitable.
If you want to understand the real performance of your marketing—and eventually forecast how many jobs your advertising can generate—you have to look beyond the lead and track the entire funnel.
The question to ask instead
Instead of asking, “How much are my leads costing?” start asking, “How much does it cost me to acquire a customer, and how much revenue does my advertising produce?”
Infographic
The Contractor Marketing Funnel
Ad → Lead → Contact → Qualified Lead → Appointment → Estimate → Sold Job → Revenue. Here's what that looks like for one month at $4,000 in ad spend.
Ad spend
$4,000
Leads
50 leads · $80 CPL
Contacted
35 · 70% contact rate
Qualified
30 · $133 each
Estimates
20 · $200 each
Sold jobs
7 · 35% close rate · $571 each
Revenue
$84,000 (7 jobs × $12,000)
Every stage loses people. Cost per lead only measures the first one.
Cost Per Lead Is Only the Beginning
Let’s say you spend $4,000 per month on advertising and generate 50 leads. Your cost per lead is $80.
At first glance, that may look great. But some of those people will not answer their phone, some will be outside your service area, some will have the wrong type of project, and some will receive an estimate but choose another contractor.
The lead is not the final result. It is simply the first measurable step in the sales process. To understand whether advertising is profitable, you have to measure what happens after the lead arrives.
1. Start With Ad Performance
Before someone becomes a lead, they first have to notice your advertising. Click-through rate, engagement rate, comments, likes, saves, shares and video engagement are useful diagnostic indicators.
They do not equal revenue. But they help answer an important question: Is this content relevant to the people we are trying to reach?
When people click, watch, comment, save or share, it is a good early signal that your message, creative or offer is resonating. This is especially useful with a new campaign, before enough lead data exists to judge quality.
If nobody clicks, or people scroll past the video immediately, that tells you something too. Think of ad metrics as the first diagnostic layer of your marketing funnel.
Metric 22. Measure Cost Per Lead—But Don’t Stop There
Eventually, someone clicks your ad, visits your landing page or opens your Facebook lead form and submits their information. You have a lead.
Facebook may tell you that your cost per lead is $48. Google Ads may show a $92 cost per conversion. The dashboard looks clean, but not every lead will actually talk to you.
Dashboard CPL vs. real cost
50 leads at $80 = $4,000 spent. If only 25 people ever respond, your real cost per contacted lead is $4,000 ÷ 25 = $160 — double what the dashboard shows.
That is why judging marketing strictly by CPL can be misleading. A lead form submission is only the beginning.
Metric 33. Track Your Contact Rate
Contact rate is the percentage of incoming leads that turn into conversations. If you generate 50 leads and successfully speak with 35, your contact rate is 70%.
Formula
Contact Rate = Contacted Leads ÷ Total Leads × 100
Example: 35 ÷ 50 × 100 = 70%
This number separates a marketing problem from a lead-handling problem. When enquiries are coming in but the contact rate is low, the issue may be:
- Slow response times
- Calls going unanswered
- Insufficient follow-up or too few contact attempts
- Leads being forgotten
- No automated text or email follow-up
- Calling at the wrong times
Without tracking it, it is easy to blame the ads.
Metric 44. Measure Cost Per Qualified Lead
Once you speak with a prospect, the next question is whether this person is a real opportunity. You may call them qualified leads, sales-qualified leads (SQLs), or marketing-qualified leads (MQLs). The name matters less than the definition.

A qualified lead has a legitimate project, in your service area, that you actually do.
For a contractor, a qualified lead has responded, has a legitimate project, is in your service area, needs a service you provide and has enough interest to continue the conversation.
Formula
Cost Per Qualified Lead = Ad Spend ÷ Qualified Leads
Example: $4,000 ÷ 30 = $133.33 (vs. $80 raw CPL)
5. Track Your Appointment or Estimate Rate
The next stage is where marketing begins turning into sales. You have spoken with the prospect, they have a legitimate need, and now you need to convert that conversation into an appointment, consultation or estimate.
Formula
Appointment Rate = Estimates ÷ Qualified Leads × 100
Example: 20 ÷ 30 = 66.7%
If qualified lead volume is strong but few people schedule, examine your intake process, how the service is explained, pricing expectations, appointment availability, sales scripts, follow-up procedures and qualification criteria.
Metric 66. Calculate Cost Per Estimate
Cost per estimate shows how much advertising spend is required to put your salesperson or estimator in front of a potential customer.
Formula
Cost Per Estimate = Ad Spend ÷ Estimates
Example: $4,000 ÷ 20 = $200
For many contractors, this is more useful than CPL. The estimate is a genuine selling opportunity: your team has the opportunity to win the project.
Metric 77. Measure Your Close Rate
Not every estimate becomes a job, and that is completely normal. Customers compare contractors, pricing, products, warranties, reviews and personalities. Sometimes they decide not to move forward at all.
Close rate tells you what percentage of estimates become sold jobs.
Formula
Close Rate = Sold Jobs ÷ Estimates × 100
Example: 7 ÷ 20 = 35%
Across contractor accounts we work with, we often see closing rates in the general 30%–50% range for qualified appointments and estimates. The actual result depends on the industry, salesperson, pricing, lead source and market conditions. The point is not a universal benchmark; it is knowing your number.
Once you know your close rate, you can forecast. If every 10 estimates typically produce four sales, and you want 20 jobs next month, you know you need roughly 50 estimates. Then you can work backwards to calculate the qualified leads and ad spend required.
Forecast: working backwards from your goal
20
sold jobs (goal)
50
estimates needed at a 40% close rate
75
qualified leads at a 66.7% appointment rate
~$10K
ad spend at $133 per qualified lead
Illustration using this article’s example rates: 40% close rate, 66.7% appointment rate, $133 per qualified lead.
8. Calculate Customer Acquisition Cost or Cost Per Contract
At AdHouse, one of the numbers we pay close attention to is cost per contract: how much advertising spend it takes to generate one signed job.
Formula
Cost Per Contract = Ad Spend ÷ Sold Jobs
Example: $4,000 ÷ 7 = $571
With $4,000 in ad spend, 50 leads, 30 qualified leads, 20 estimates and 7 sold jobs, your cost per contract is $571. This is a much clearer way to evaluate performance. If your average job is worth $10,000, spending $571 in advertising to acquire that customer may be highly profitable.
For some windows and doors campaigns we work with, cost per signed contract can fall roughly in the $700–$1,000 range. Compared with a $50 or $80 CPL, that number may sound high. But when the average order value is $10,000, $15,000 or more, the economics can still be excellent.
Infographic
How Your Real Cost Climbs Down the Funnel
Here’s what the same $4,000 in ad spend costs at each stage of the funnel.
Per lead (CPL)
$80
Per contacted lead
$114
Per qualified lead
$133
Per estimate
$200
Per signed contract
$571
Same $4,000 budget, five different answers. Only the last one tells you whether the campaign made money.
Two Campaigns Can Have the Same CPL and Completely Different Results
Two campaigns can each generate 50 leads at $80. From the advertising dashboard, they look nearly identical. But after the leads move through the funnel, the business outcomes can be completely different.
Campaign A
$84,000
revenue · $571 per contract
Same $80 CPL
Campaign B
$24,000
revenue · $2,000 per contract
Metric
Campaign A
Campaign B
Ad Spend
$4,000
$4,000
Leads
50
50
Cost Per Lead
$80
$80
Qualified Leads
30
15
Estimates
20
10
Sold Jobs
7
2
Average Job Value
$12,000
$12,000
Revenue
$84,000
$24,000
Cost Per Contract
$571
$2,000
Rows in orange are where the two campaigns split. None of them appear in an ad platform dashboard.
From the advertising dashboard, the campaigns appear almost identical: 50 leads at $80 each. But one generated $84,000 in revenue while the other generated $24,000. That difference is enormous.
This is why contractors should not judge advertising exclusively by CPL.
Cheat sheet
The 8 Marketing Numbers Contractors Should Actually Track
Bookmark this table. Each metric answers a different question about where your marketing dollars go.
Metric
Formula
Example
What it tells you
1. Cost Per Lead
Ad spend ÷ leads
$4,000 ÷ 50 = $80
What it costs to generate an enquiry. Useful, but only the starting point.
2. Contact Rate
Contacted ÷ leads × 100
35 ÷ 50 = 70%
Whether leads are being properly processed by your team.
3. Cost Per Qualified Lead
Ad spend ÷ qualified leads
$4,000 ÷ 30 = $133
What a legitimate sales opportunity costs. Usually more useful than raw CPL.
4. Appointment / Estimate Rate
Estimates ÷ qualified leads × 100
20 ÷ 30 = 66.7%
How many qualified prospects agree to meet your estimator.
5. Cost Per Estimate
Ad spend ÷ estimates
$4,000 ÷ 20 = $200
What it costs to put your salesperson in front of a potential customer.
6. Close Rate
Sold jobs ÷ estimates × 100
7 ÷ 20 = 35%
How efficiently your sales process turns opportunities into revenue.
7. Cost Per Contract (CAC)
Ad spend ÷ sold jobs
$4,000 ÷ 7 = $571
What one sold job costs. For most contractors, far more important than CPL.
8. Revenue by Lead Source
Revenue tracked back to each channel
Facebook: 47 leads → 8 jobs → $116,000
Where to put more money—and where to cut.
All examples use the same month: $4,000 ad spend, 50 leads, 35 contacted, 30 qualified, 20 estimates, 7 sold jobs.
Revenue by Lead Source: The Most Valuable Metric of All
Of everything in the table above, revenue by lead source may be the most valuable number you can track.
The sentence you want to be able to say
Not “Facebook generated 47 leads,” but “Facebook generated 47 leads, 8 sold jobs and $116,000 in revenue.”
You also want to know how much actual revenue Google Ads, SEO, local search, referrals and other sources produce. Once you know that, your marketing decisions become much easier: put more money behind what produces profitable customers and reduce spending on what does not.
Your CRM Is What Connects Marketing to Revenue
None of this works well if leads disappear into spreadsheets, email inboxes or someone’s cellphone.
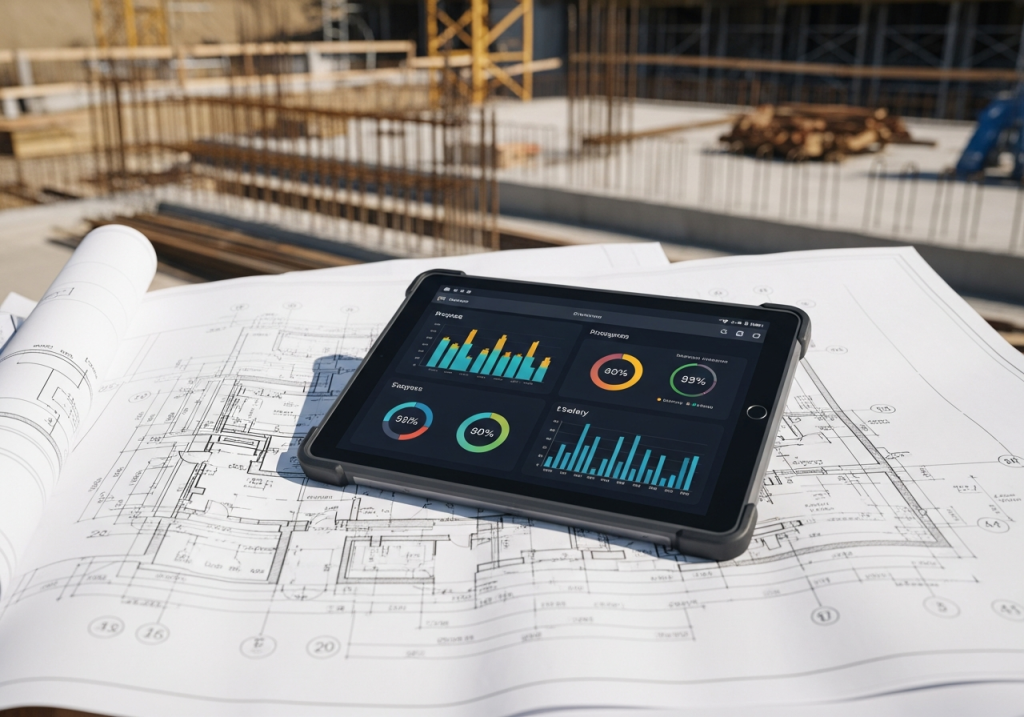
A properly configured CRM ties every lead back to its source—and forward to revenue.
A properly configured CRM lets you see:
- Where each lead came from and when they submitted their request
- How many contact attempts were made and whether they responded
- Whether they were qualified
- Whether an appointment and estimate were completed
- Whether the job was sold and how much revenue it generated
This connects advertising data to sales data. You are no longer simply buying leads; you are tracking a marketing investment all the way to revenue.
Speed-to-Lead Matters More Than Most Contractors Think
Tracking matters, but your team still has to process the lead effectively.
This is particularly important with Facebook and other interruption-based advertising. A homeowner may see an ad, remember that they have been meaning to replace their windows or repair their roof, and submit the form. At that moment, there is interest, but it does not last forever.
If they are actively shopping, they may contact several contractors. The longer you wait to respond, the greater the chance another company speaks with them first.
Respond to new enquiries as quickly as reasonably possible. These tools help make sure opportunities do not get forgotten:
Speed-to-lead toolkit
Instant SMS confirmations
Automated emails
Callback notifications
Multiple contact attempts
CRM reminders
Follow-up sequences
AI-assisted texting & voice
Appointment-scheduling automation
Technology does not replace a sales team. It helps the team respond quickly and consistently.
Cheap Leads Don’t Build Businesses. Profitable Marketing Systems Do.
At AdHouse, we do not see marketing as simply launching ads and chasing the cheapest possible lead. We build the complete system:
The AdHouse marketing system
Advertising
Tracking
CRM
Follow-Up
Sales
Revenue Attribution
When those pieces are connected, you know how much you are spending, how many leads you generate, how many you contact, how many are qualified, how many appointments are booked, how many projects are sold and how much revenue each source produces.
That lets you scale with confidence.
Related AdHouse services

Work with AdHouse
Build a marketing system that tracks every dollar to revenue
AdHouse specializes in building these systems for home-improvement and contractor businesses. We combine advertising, CRM integration, lead tracking, follow-up automation and AI tools to help contractors generate opportunities consistently and understand exactly where their marketing dollars are going.
If you are looking to put your contracting business on a more predictable growth trajectory, reach out to AdHouse. We will help you build a marketing system designed to generate leads, convert them into customers and scale profitably.
Talk to AdHouse